
Any wats step can contain a chart, and there is a dedicated Chart step as well.
Any WATS chart can contain multiple series with y-data plotted on an x-axis or x/y-data.
This article describes how you can create a step and add a chart to it.
Creating and initializing the API and creating the UUT Report:
// Instanciate and initialize the API
TDM api = new TDM();                     //Create api
api.InitializeAPI(true);                 //Initialize it

//   Create the UUT
UUTReport uut = api.CreateUUTReport("oper", "PartNo1", "Rev1", "SNGraphTest1", "10", "Seq1", "1.0.0");
Preparing the chart data
In a real life test case your chart data will probably be from a stream or return values of a test, but for this example we will first generate some sample chart data. You can use List<> or Arrays[] of doubles for to hold the x/y-data.
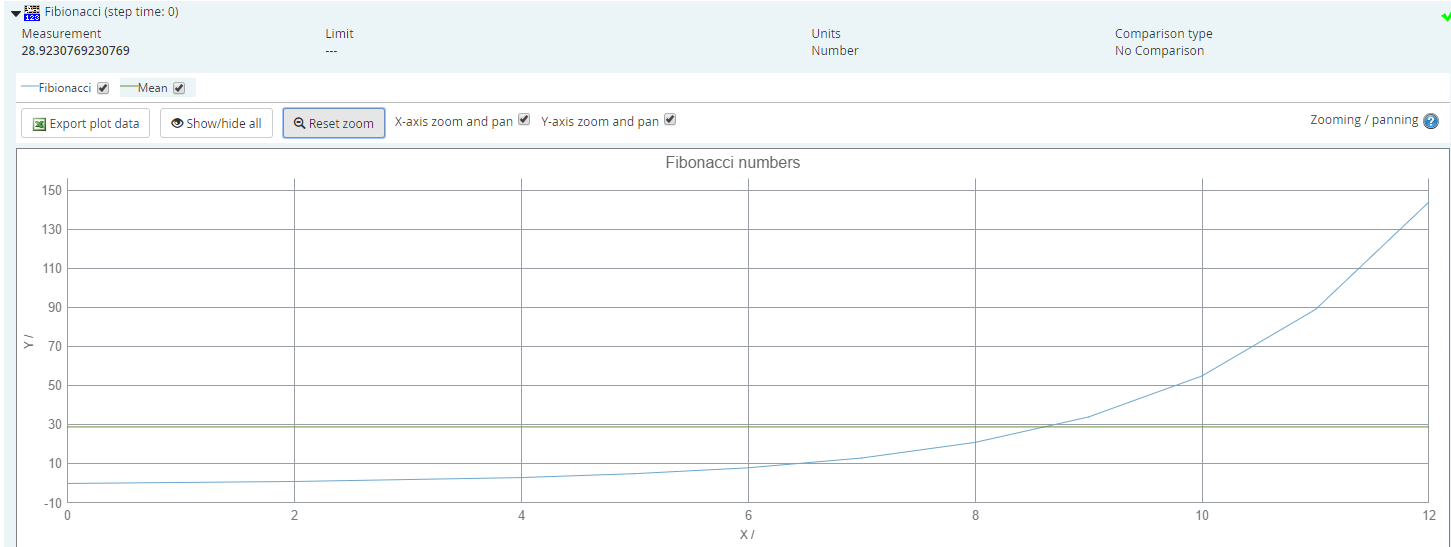
//This will go into a graph series where x=0,1,2,3,4... and y is fibionacci(x)
double[] yValuesFibonacci = new double[] { 0, 1, 1, 2, 3, 5, 8, 13, 21, 34, 55, 89, 144 };
double meanFib = yValuesFibonacci.ToList().Average(); //Take the mean value
Creating the steps and adding the data
// First get the root sequence call
roo = uut.GetRootSequenceCall();

// Add a numeric limit step to hold the chart
NumericLimitStep fibonacciStep = root.AddNumericLimitStep("Fibionacci");

// Add a test that represents the mean value of the chart.
// You can also consider adding max/avg/min and so on
fibonacciStep.AddTest(meanFib, "Number"); //Add a test with no limits on the mean value

// Now create the chart
Chart fibChart=fibonacciStep.AddChart(ChartType.Line, "Fibonacci numbers", "X", "", "Y", "");

// And add the series.
fibChart.AddSeries("Fibionacci", yValuesFibonacci); //1 series
fibChart.AddSeries("Mean", new double[,] { { 0, yValuesFibonacci.Length - 1 }, { meanFib, meanFib } }); //Also plot the mean value
Here is the resulting graphs shown in WATS:
Comments
0 comments
Please sign in to leave a comment.