Teststand graph in Wats report

Hello...
I want to save a graph to my Wats-reports, but I think it is difficult to understand how to do it by reading your documentation on the "XY Graph Multiple numeric limit test" subject.
https://support.virinco.com/hc/en-us/articles/207424563-XY-Graph-Multiple-numeric-limit-test
I have generated a data array and a time array in Teststand. How do I transfer them to the Wats "XY Graph Multiple numeric limit test" step?
Do I have to do it through LabView or should I somehow transfer my data to the data-arrays in the step? If so which and how?
I am using LV/TS 2014.
-

@Kenneth Metzsch
In the meantime I found a way.
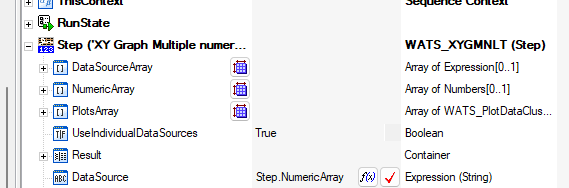
For the x,y Plot if you if have only one y array you need to fill your data into the Step.PlotsArray[0].PlotData which contains a container for each point holding the x and y value.
If you additionally want to compare your y values against limits you need to have an array holding only the y values and assign them to the array Step.NumericArray.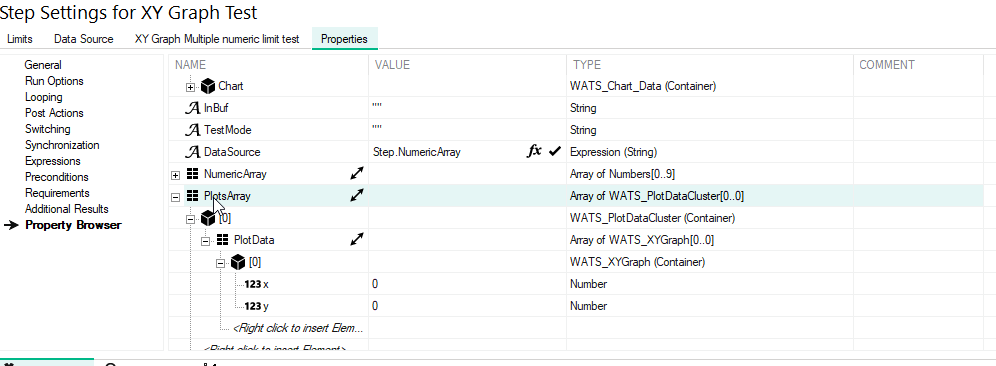
Please sign in to leave a comment.
Comments
2 comments