Added functionality for dashboard widgets related to "Connection & Execution time"
Hi
We'd like to have the summary table in the "Connection & Execution Time" report, made available as a widget, or at least have the existing widgets be able to sum the values, if you're grouping data.
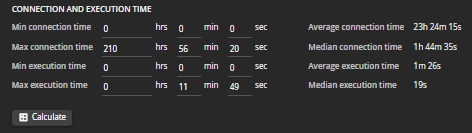
Related to this, we'd like to have the "Cost Analysis grid" widget have options to:
- select Connection, Execution or both
- have the widget show the split between connection and execution time by default.
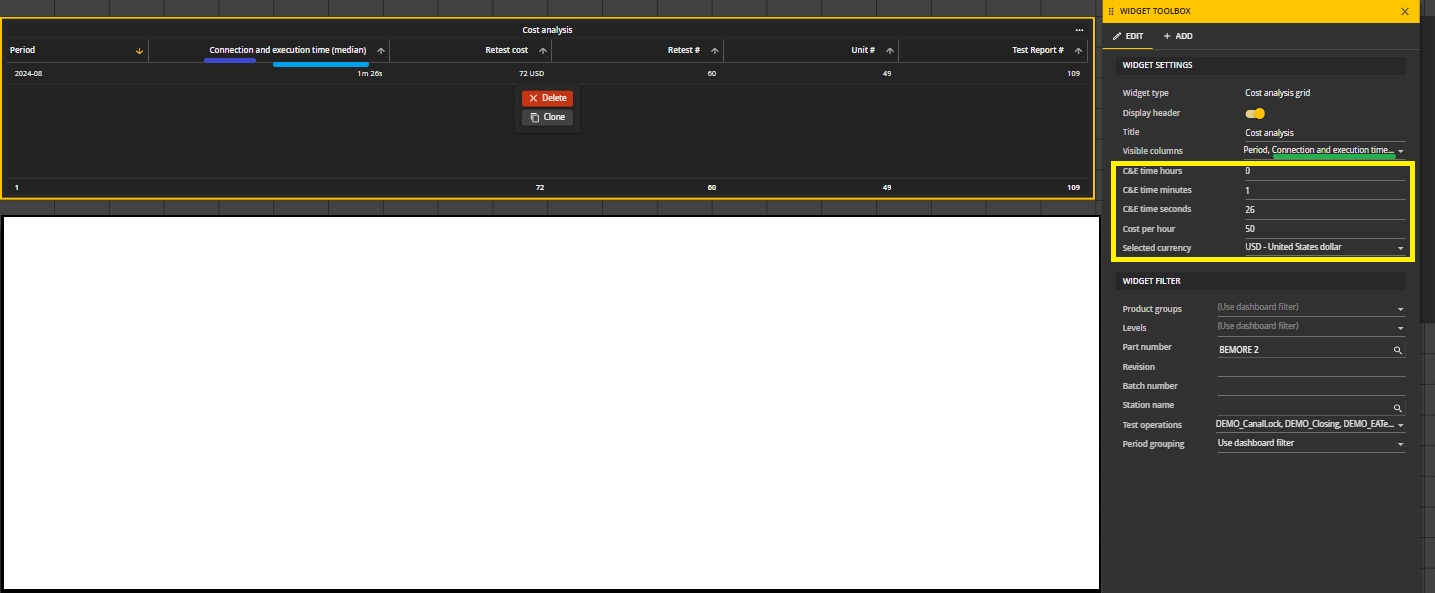
Currently the workaround is to edit the dashboard for the execution time, manually, but we'd like the dashboards to function as dynamically as possible.
Please sign in to leave a comment.
Comments
1 comment