Measurement of Dashboards charts show histogram
Completed
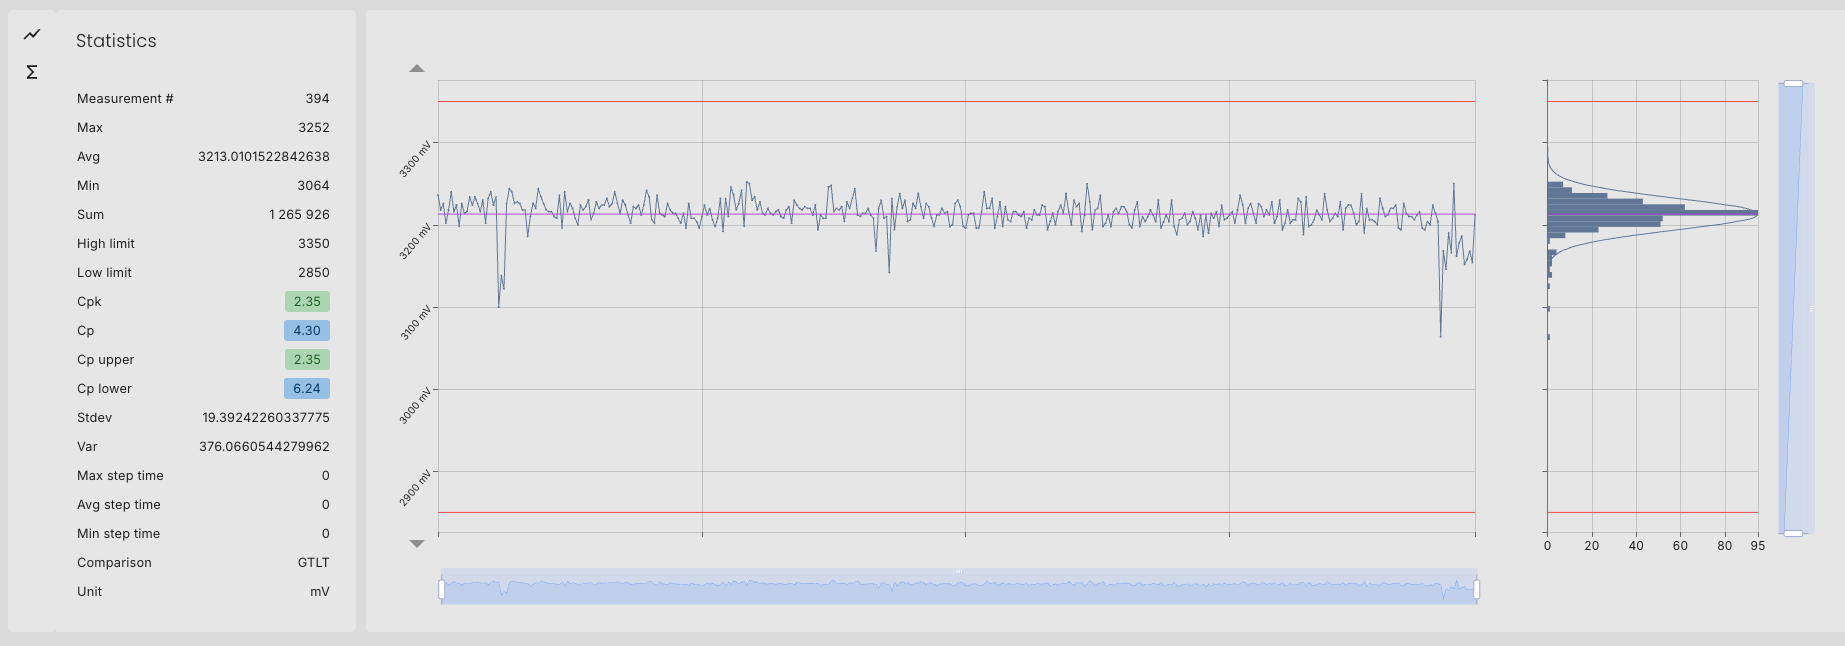
In Dashboards, having a histogram view for the measurement charts would be helpful for reviewing specific test step groups by station — similar to the histogram available in the Test Step Analysis.
-
Official comment

New dashboard widgets for Individual measurements and Aggregated measurements charts are being introduced. The Individual measurements chart widget will include the optional Frequency chart (histogram) that you are referring to.
These widgets will be included in the upcoming biweekly cloud update. In the release notes, the feature will appear as a major update under the name “TSA dashboard widgets.”
Comment actions

Please sign in to leave a comment.
Comments
2 comments